QuickSpots Antibody Array Analysis Documentation
Index- Result Sets Box
- Save, Load & CSV Export
- Select Spot Pairs
- Data Layout
- Spot Values or Pair Averages
- Spot Values or Changes
- Base Data Set
- Graph Data Sets or Spot Pairs
- Background Subtraction
- Normalization
- Display Data Ranges
- Note Regarding Numerical Values
- Graph Controls
- Graph Export Mode
Results Tab
Clicking the Generate Results button on the Auto Place tab will bring you to this tab. While you can activate this tab by clicking the Results button, you must click the Generate Results button on the Auto Place tab to actually generate results data. If you have previously generated results data and saved it using the “Save” button, you can come directly to this tab by click the “Results” button and reload it using the “Load” button.
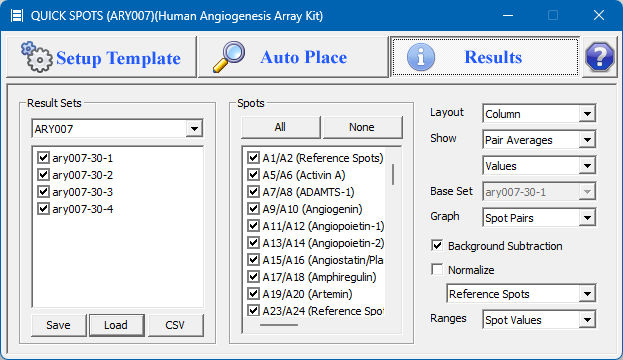
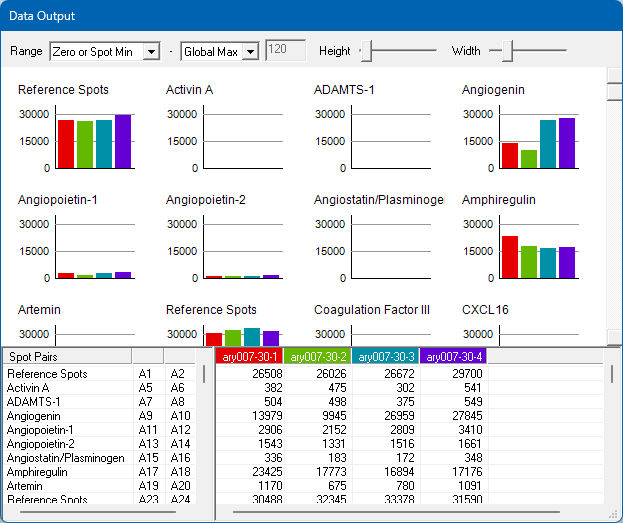
This tab is used to output the results from one or more arrays that have been processed using the first two tabs. Whenever this tab is open, a second window will appear in which the data and related graphs are displayed.