
QuickSpots Antibody Array Analysis Documentation
Index » Results TabDisplay Data Ranges
There will always be some noise, or inaccuracy, in your array images. You will notice, for example, that the values of the two spots in each spot pair are almost always different. Spot pair averaging is used to calculate the best possible estimate of the true value of the protein being measured. However, it is important to recognize that even the pair average is not perfectly accurate.
Inaccuracies can be caused by any of a number of factors. Obviously, the arrays themselves are not 100% identical down to the last molecule. Random differences might arise during your experiment or imaging.
QuickSpots’ Ranges feature can help you determine how accurate your results numbers are, and to assess whether the numbers from different arrays are significantly different, or how likely it is that any apparent differences are the result of noise. (Be aware that, as noted above, in order for direct comparisons between the numbers from different arrays to be valid the data must be normalized. This applies to comparisons based on the Ranges displayed by QuickSpots as well.)
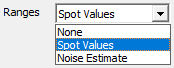
The Ranges setting does not affect the numbers displayed by QuickSpots. Instead, it adds a range display to the graphs. QuickSpots offers two options for how to calculate ranges.
The “Spot Values” option simply displays lines indicating the values of each of the spots in your spots pairs. The colored bars show the pair averages, and the added lines extend above and below to the individual spot values.
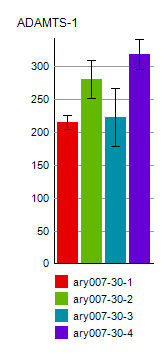
The intuitive assumption that we might make based on the individual spot pair values is that the true value lies somewhere in between. However, this is only true 50% of the time. Given that each spot is either above or below the true value (except in the rare case when a spot is completely accurate), the two spots only bracket the true value if one is higher than the true value and the other is lower. We can expect that 50% of the time, either both will be higher, or both will be lower.
Recognizing this, it is reasonable to conclude that when the values of the spots are very close to each other, this isn’t necessarily because the measurement is highly accurate. It is more likely that they are either both too high or both too low. The more different the spot values are from either other, the more likely they are to be on opposite sides of the true value.
To compensate for this, QuickSpots has a second range calculation option: “Noise Estimate”. When this option is selected, QuickSpots measures the differences between each of the spot pairs on the array and performs a least squares fit calculation to determine a curve correlating spot intensity to the difference between spot pairs. Then, when displaying ranges on the graphs, for each spot pair, if the actual difference between the two spots is greater than the calculated noise estimate, the actual values are used. But if the noise estimate is greater, it is used to display the range.
Thus, for spot pairs whose values are very close together, suggesting a likelihood that they are both either too high or too low, and expanded range is displayed which is more likely to bracket the true value.
Once the spot pairs from all of the arrays have been normalized and their averages and ranges graphed, if the ranges do not overlap, or overlap only slightly, this may indicate that the true values are actually different. If the ranges do overlap, the degree of overlap indicates the likelihood that the true values are not significantly different, or that additional testing may be needed.