
QuickSpots Antibody Array Analysis Documentation
Index » Results TabSpot Values or Changes
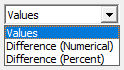
Use this control to determine whether to display spot values or the difference between the value of the spots in different data sets. When either of the “Difference” options is selected, one data set acts as the base, as described below, and each of the other data sets is compared to it.
Changes may be displayed as numerical differences between the values in the different data sets, the percentage change (ie. the percentage of the value of the base data set), the “fold change” (eg. double the value is a “two fold” change, so the value displayed would be 2.0), or Log Base 2 of the Fold Change. For example, if the value of a particular spot in the base data set is 1000, and the value of that spot in another data set is 1100, the difference may be displayed as 100 (“Change”), 10% (“% Change”), 1.1 (“Fold Change”), or 0.14 (“Log2(Fold Chg)”).