
QuickSpots Antibody Array Analysis Documentation
IndexPurpose & Introduction
The purpose of QuickSpots is to help you quickly and easily process images of arrays used in scientific research.
The current version of Quick Spots supports Proteome Profiler™ Antibody Arrays, manufactured by R&D Systems, as well as a variety of arrays from Abcam and RayBiotech.
Each array kit has an associated Product Datasheet available on the manufacturer’s website. In the associated datasheet is a section labeled “DATA ANALYSIS” or something similar which is the official instructions for how to use and analyze the array. The Quick Spots Tool is not a replacement for these official instructions.
The Quick Spots Tool helps the user quickly and easily analyze their arrays by creating an on-screen overlay of the circles from the associated PDF datasheet and template, measuring the values of the spots in those circles, displaying and graphing the data, and outputting the measured values in those circles to a comma separated values (CVS) file that can be opened by a spread sheet program such as Microsoft Excel.
Terminology used in this document:
| Term | Description |
| Image | The image file produced by scanning a processed array, normally an 8-bit Grayscale or 24-bit Color image |
| Spot | A “Spot” is an exposed area on an image of an array |
| Template | A set of circles matching the overlay for an array |
| Template Type | A Template will have a Template Type or model number such as ARY003 or ARY007, etc. |
| Circle | The area that will be used to calculate the average grayscale value of an image for a given spot |
| Blob | An area on an image that Quick Spots is treating as a Spot for the purpose of automatically aligning Circles to the image |
The OptimEyes environment and the Quick Spots Tool help the user perform the following:
- Load a user’s scanned in image of an array into the OptimEyes environment.
- Help the user place correctly sized circles around the spots on the user’s scanned image of the array according to the template and instructions given in the manufacturer’s product datasheet.
- Perform calculations on the values of the spots such as background removal, normalization, and compensation for noise in the images.
- Display the computed values along with charts that can be used to compare arrays.
- If desired, the numbers can be exported to a comma separated values (*.csv) file that can be opened in spreadsheet software such as Microsoft Excel for further analysis.
- NOTE: Numerical values will range between 0 and 65,535 (unless the values are normalized as described later in this document.) There is no particular significance to this range – it is simply the range of a 16-bit number in computer memory. The significance of the numbers is the difference between values for the various circles. Quick Spots will accurately report what is in the image to the extent that the user ensures that the template is aligned correctly. Beyond that, Ideal Eyes Systems has no opinion as to the meaning of any results. Interpretation of the numbers is up to the user.
For example the ARY005 kit contains a template with circles that will measure the associated spots for the given array. The template has circles that are labeled A1 to E20 in a grid pattern as follows:
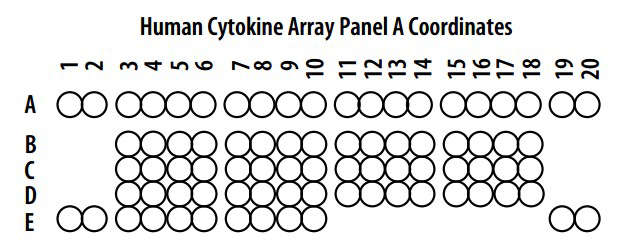
The software helps the user create circles that are correct for the template associated with the selected kit on the user’s scanned image of their array.
Once the circles are accurately positioned on the image, the software will compute the average grayscale pixel intensity for all pixels inside the associated circles.
« Index | Template Setup Tab »