
 QuickSpots Antibody Array Analysis
Quickly & Easily Go From Spot Arrays to Data Analysis
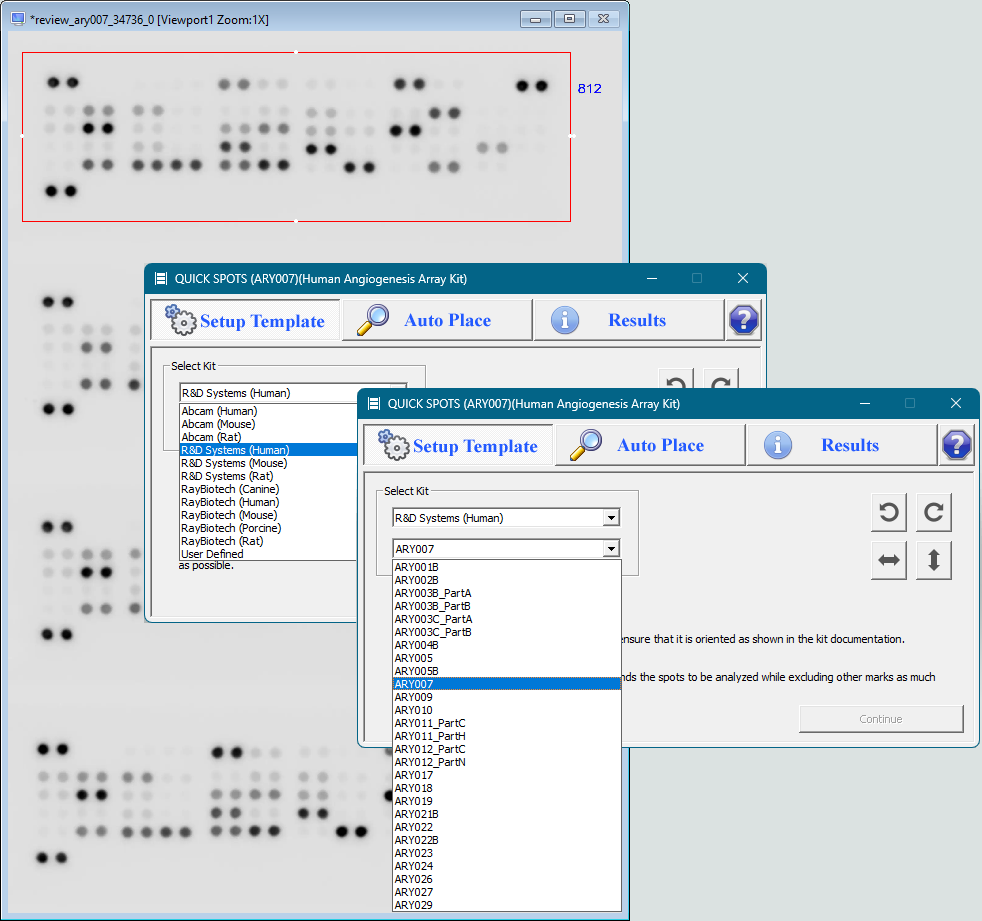

Step 1: Select Your Array
Select the manufacturer (currently supporting Abcam, R&D Systems, and RayBiotech) and category (eg. human, mouse, rat), then select the specific array model.
Open your image and draw a box around the array you want to process.
Click "Continue" to move to the next step.
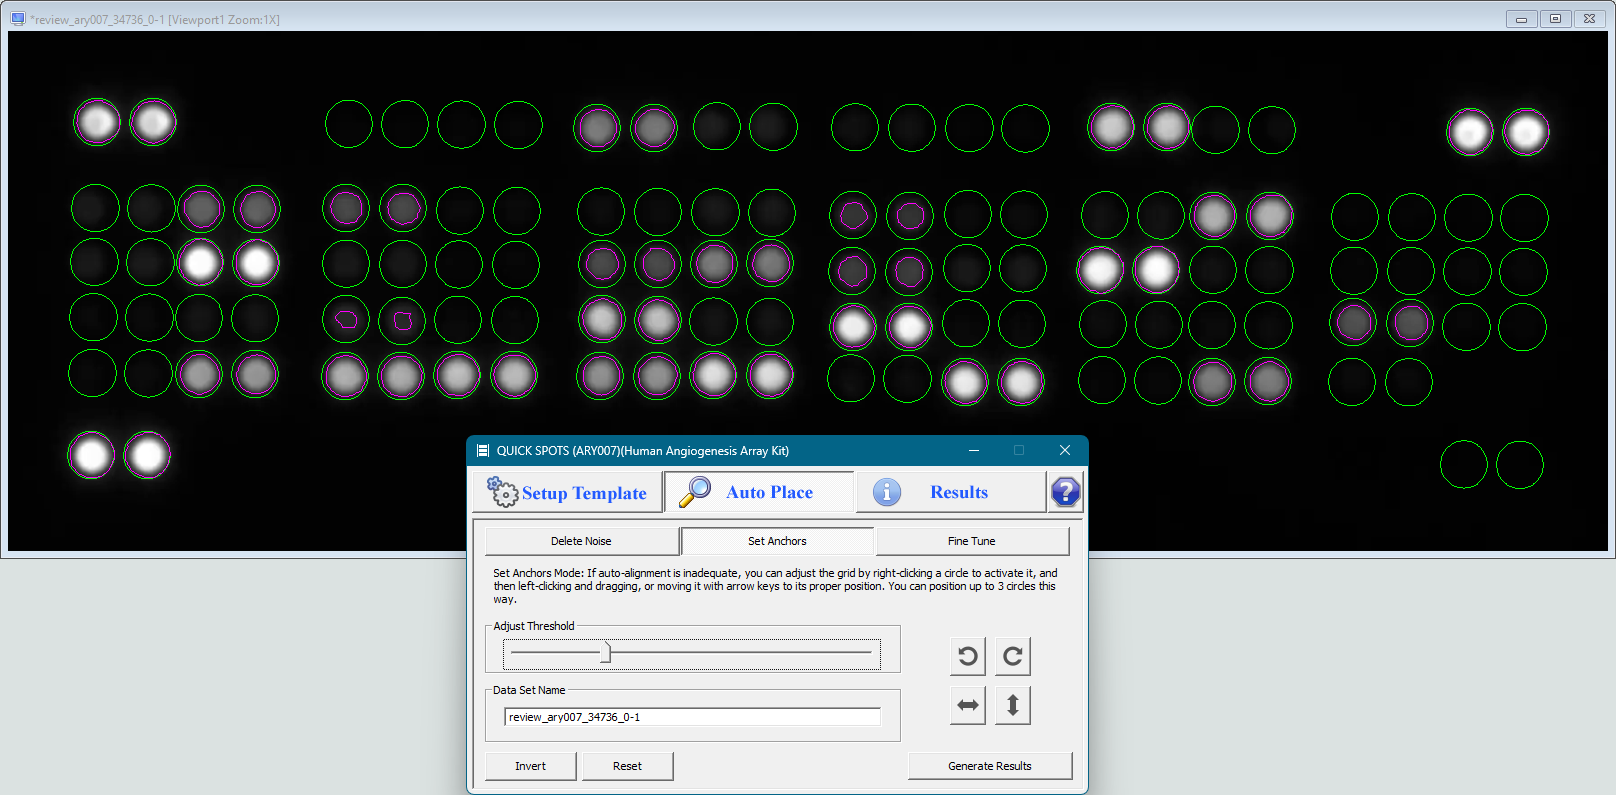
Step 2: Align The Template
QuickSpots will automatically align the array template with the spots in your image. If required due to image quality issues, use the supplied controls to complete the alignment.
Click "Generate Results" to capture your pixel density data. Then return to the "Setup Template" tab and repeat steps 1 and 2 as needed for additional arrays.
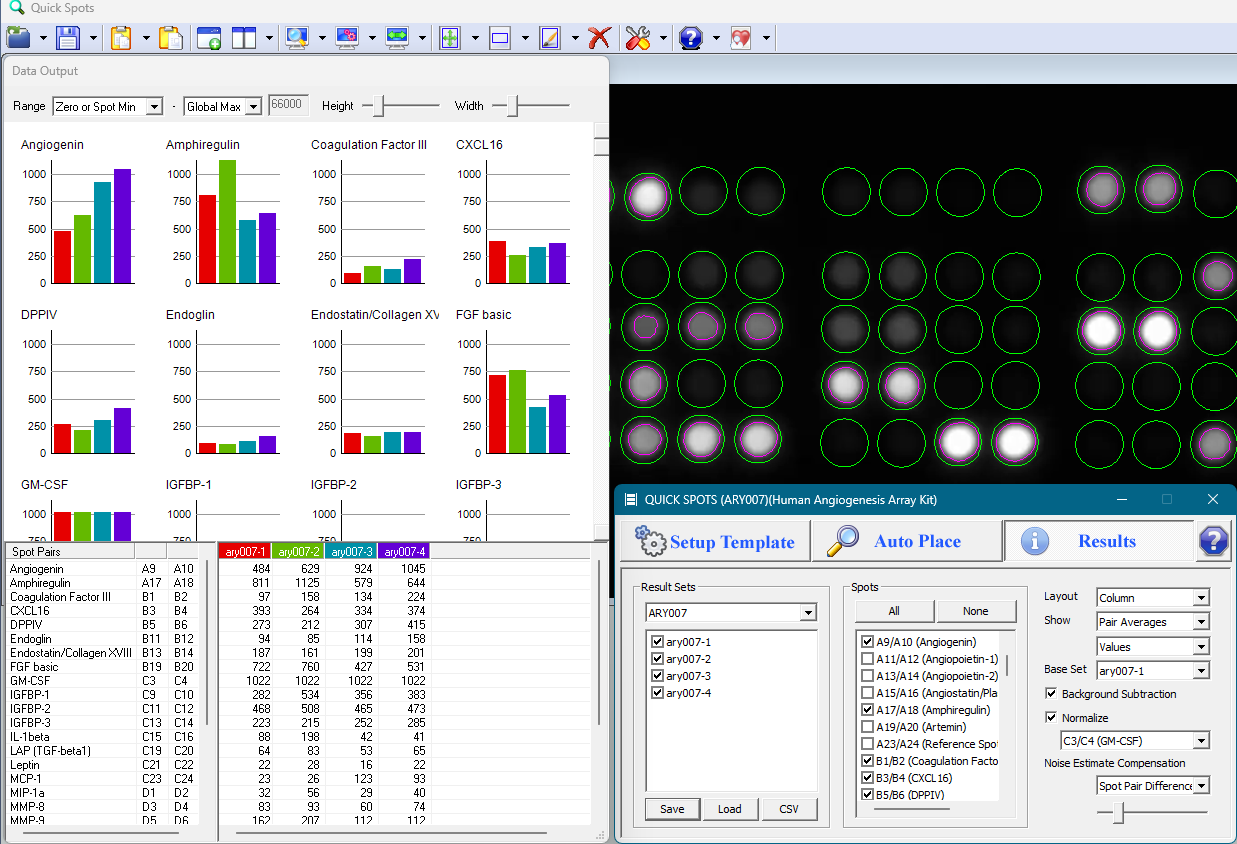
Step 3: Set Calculation Options & View Results
Adjust options as desired to calculate spot pair averages, background removal, normalization, change between arrays (numerical, percentage, fold change, and log base 2 of the fold change), and more.
If desired, adjust chart options such as sizes and data ranges. Charts can be exported in PNG format.
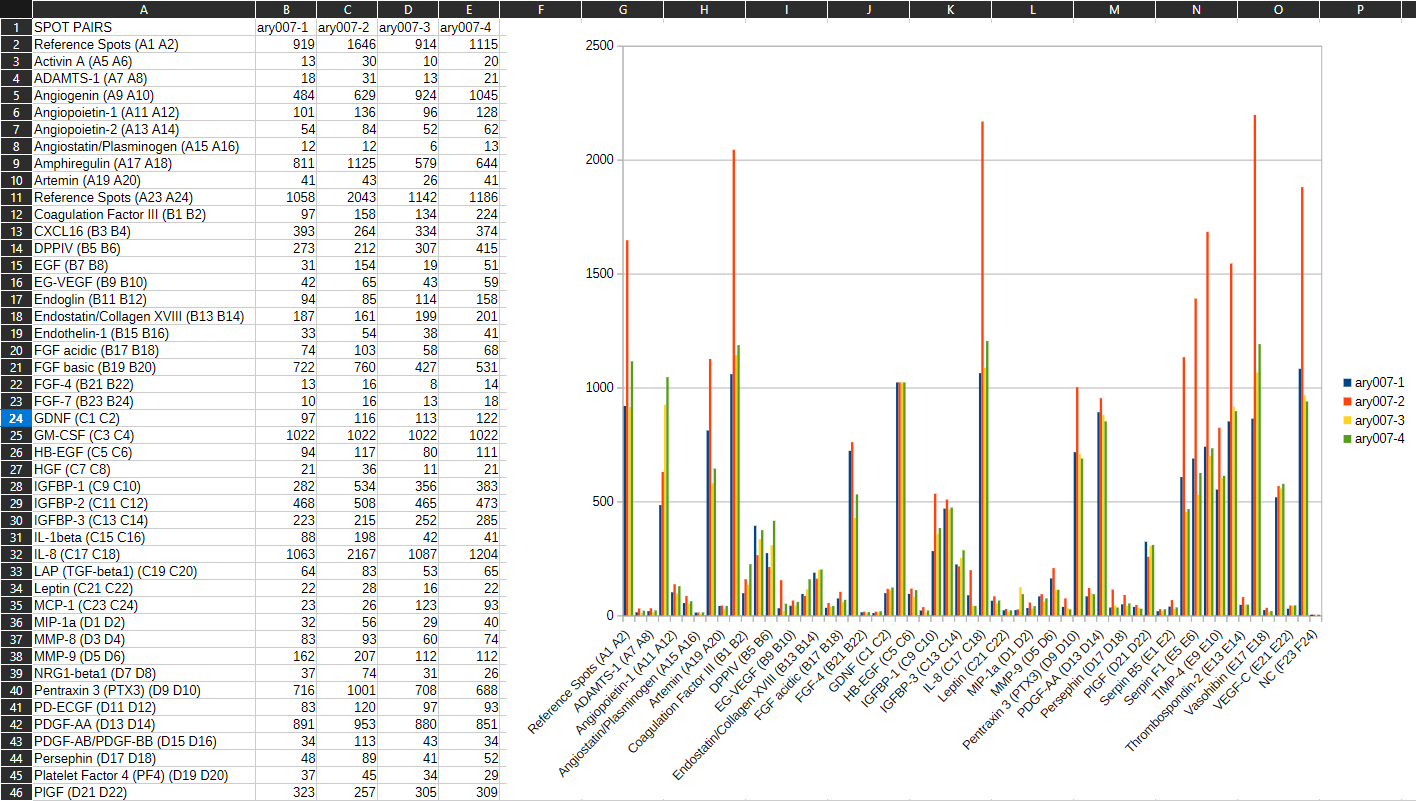
Step 4: Export Data (Optional)
Optionally, export your data to a CSV file for use in programs such as Microsoft Excel, Google Sheets, LibreOffice Calc, etc.
With QuickSpots' advanced template alignment algorithm, the entire process can often be completed in as little as one minute (see demonstration video below).
Download QuickSpots
|
Click to Download QuickSpots 25.9.0.9
Requires 64-bit Windows |
Get an Activation Code
After installation, QuickSpots will ask for an Activation Code when launched. Select a purchase option below. Then generate your code here.
| 7-Day Trial License |
60-Day License |
1-Year License |
Perpetual License |
|
| Price | Free | $79 USD | $395 USD | $1,995 USD |
| 35 Abcam Array Templates |  |
|
|
|
| 38 R&D Systems Proteome Profiler™ Templates | |
|
|
|
| 83 RayBiotech Array Templates | |
|
|
|
| Additional templates created on request* |  |
|
|
|
| Auto-align template, compensating for variation in spot position | |
|
|
|
| Options for background subtraction, normalization | |
|
|
|
| Display individual spot values or pair averages | |
|
|
|
| Display measured values or changes between arrays | |
|
|
|
| Multiple graphing options, including range display based on individual spot values or estimated "noise" level | |
|
|
|
| Export data for additional analysis in Excel or other programs | |
|
|
|
| Free updates to all future 25.X versions* | |
|
|
|
| Get a one-time free trial |
- We accept purchase orders on a case-by-case basis.
- All licenses are single-computer licenses
- We will supply templates for additional array models from any manufacturer on request, at no charge, provided they do not require modifications to the QuickSpots program. Modifications requiring software updates will be considered on a case-by-case basis. If you have questions about the possibility of supporting a particular array model, please contact us.
- Free updates: all currently foreseeable updates are intended to be added as updates to QuickSpots version 25. Such updates may include the addition of array templates, whether from the same or different manufacturers; as well as any functionality updates and additions that don't substantially alter the nature of the software.
QuickSpots is used by medical researchers at:
- Agenus
- Albert Einstein College of Medicine
- Aurogene
- Baylor College of Medicine
- BBOT
- BioAge Labs
- Celcuity
- Cellapeutics BIO
- Children's Hospital of Philadelphia
- Cincinnati Children's Hospital
- Dana-Farber Cancer Institute
- DIMEPRE-J
- GenoChem World
- Genosco
- Georgetown University
- ILAb
- INSERM
- Johns Hopkins University
- Loxo@Lilly
- Massachusetts Institute of Technology (MIT)
- Mayo Clinic
- Medical College of Wisconsin
- Memorial Sloan Kettering Cancer Center
- National Institutes of Health (NIH)
- Organogenesis
- Penn State College of Medicine
- Regeneron
- Ride Therapeutics
- SILAB
- St Jude Children's Research Hospital
- Städtische Klinikum Dessau
- Tegara
- UAB Medicine
- UK Health Security Agency
- United Therapeutics
- Universitätsklinikum Schleswig-Holstein
- University Hospital Muenster
- University of Heidelberg
- University of Michigan
- Yonsei University
- ...and many more.
All trademarks, service marks, and trade names appearing above are the property of their respective owners. If any owner does not wish to have their information listed, please contact us for removal.
News & Updates
September 14, 2026
QuickSpots version 25.9.0.9 is available for download. This update includes the following changes: Templates were added for Abcam arrays ab193656 (Human Cytokine Antibody Array, membranes C6 and C7) and ab133999 (Mouse Inflammation Antibody Array). Options were added for calculating the fold change between arrays as well as Log base 2 of the fold change. (Also...August 3, 2026
QuickSpots version 25.9.0.7 is ready for download. This update includes the following improvements: The experimental Noise Estimate Compensation feature from version 25.9.0.0 has been replaced with a more concrete method of assessing the accuracy and significance of your array data. The new Ranges feature adds a value range bar to the graph of each spo...July 22, 2026
QuickSpots version 25.9.0.2 is available for download. This update adds another graphing option for your antibody array data. Where the previous update grouped chart data by spot pair, this version also enables grouping by data set (ie. by array). The new option is the default for array models which do not support normalization using positi...Additional Resources
Software License Agreement